Retain numerator, denominator and period. Explain the two values first, then the point difference and, if useful, relative change with its base.
Write what the rate divides
Before calculating, identify the event counted and the set it belongs to. A request-completion rate might mean finished forms among started forms. That is different from buyers among visitors. Keep the same definition in both periods and record exclusions, window and data source.
Eurostat uses percentage points to compare percentages. That unit describes the distance between rates without confusing it with relative change. The following fictional data let you reconstruct the calculations; they are not this website’s results.
Keep counts beside percentages
| Measure | Period A | Period B |
|---|---|---|
| Requests started | 100 | 100 |
| Requests completed | 20 | 30 |
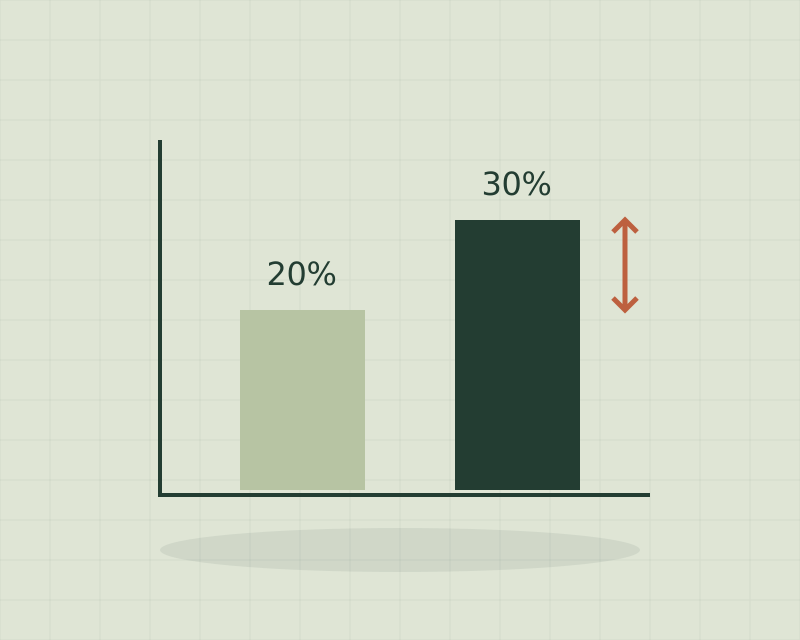
| Completion rate | 20% | 30% |
In A, 20 ÷ 100 × 100 = 20%. In B, 30 ÷ 100 × 100 = 30%. The rate difference is 30 − 20 = 10 percentage points. This example also has ten additional completed requests because both denominators are one hundred.
Avoid summarizing this as “up ten percent” when describing that distance. Write the unit in full the first time and explain pp if abbreviating later.
Show what growing 50% means
For relative change in the rate, divide the difference by the initial value: (30 − 20) ÷ 20 × 100 = 50%. The denominator 20 is the initial rate expressed in the same units as the final rate, rather than the number of requests started. The data.europa.eu guide explains this distinction between a difference and relative change.
A complete sentence would be: “The rate moved from 20% to 30%, a difference of 10 percentage points and a relative increase of 50% over the initial rate.” The second percentage does not mean the final rate is 50%. Choose the presentation useful for the decision and keep both bases available.
Recalculate when volume changes
Now imagine another period B with 50 requests started and 15 completed. The rate remains 30%, but completions fell from 20 to 15. Their change is (15 − 20) ÷ 20 × 100 = −25%. A higher rate and fewer completed cases can coexist because the denominator also changed.
Do not silently substitute this alternative B for the table’s B: these are different scenarios. Always show the counts needed to reconstruct each rate. If the set’s definition changed, first check whether the comparison remains valid.
Explain what the calculation does not establish yet
The numbers do not explain why the rate changed. People, request difficulty or measurement may have changed. Attributing an effect to a campaign or new screen requires suitable evidence and a comparison design.
When the initial value is zero, this relative-change formula cannot divide by it. Report the values and difference without inventing an infinite growth rate. When figures are rounded, avoid claiming more precision than they support. Our metrics guide helps review coverage and units.
Keep a sentence that makes the report verifiable
Use this order: indicator and definition; counts in each period; rates; difference with its unit; supported explanation and open questions. On a brief slide, the point change can be the headline with its bases immediately below.
The order-average guide reviews composition and prices, a different statistical question. Business-news reading separates data and interpretation. This record checks what a change between two proportions actually means before turning it into a business conclusion.
Follow the evidence.
Sources checked October 19, 2026. Illustrative scenarios and numbers are fictional. The records and exercises are original editorial proposals, without attributed customer results or provider tests. Our editorial standards.